In Perú, the Instituto Nacional de Estadística e Informática (INEN) is the government agency in charge of statistical information. In this post, we will be looking at crime data from http://criminalidad.inei.gob.pe.
We can download the number of crime complaints by type and region. As we would like to compare different regions it’s important to express the numbers as a population ratio rather than absolute counts. We can find the population by region on INEI series.
Here is a view of the numbers and ratio of complaints by region and type:
Region similarities
Now let’s use some dimensionality reduction like PCA to see how similar are the different regions by crime types.
- The X axis is showing the first component, which explains 95% of the variation.
- The size indicates population.
Maps
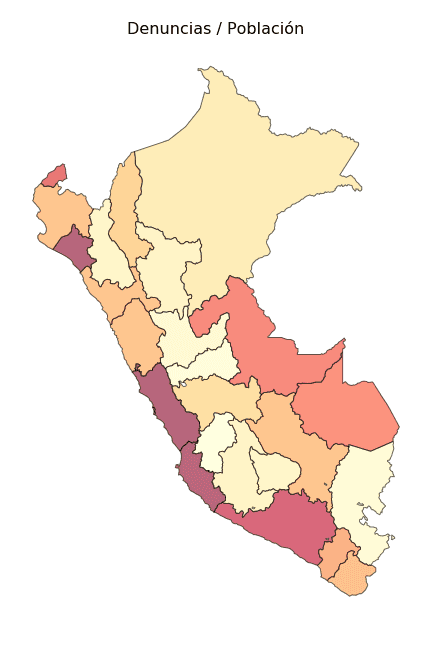
Now, using geopandas and matplotlib, we can plot some maps. Here we have the crime complaints / population by region:

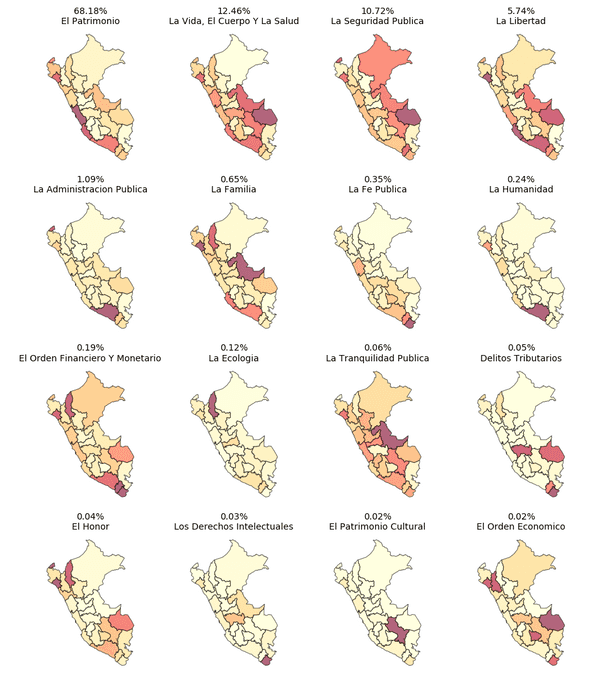
Finally we can show maps for the most recurrent crimes types:

Code used in the post
You can find the python code here: Notebook.