Work in progress
A utility to visualize models.
Main idea:
- Use this library to attach a learner and initialize a proxy server.
- Connect a javascript client via fastexplorer-js.
- Send back and forth relevant information to be visualized.
This will allow to use tools like d3, react and threejs to visualize NN information.
pip install git+https://github.com/renato145/fastexplorer.git
%reload_ext autoreload
%autoreload 2
Load you Learner as usual and import fastexplorer:
from fastai.vision.all import *
from fastexplorer.all import *

path = untar_data(URLs.PETS)
files = get_image_files(path/"images")
def label_func(f): return f[0].isupper()
dls = ImageDataLoaders.from_name_func(path, files, label_func, item_tfms=Resize(224))
learn = cnn_learner(dls, resnet34, metrics=accuracy)
When ready, start serving the server:
learn.fastexplorer(True)
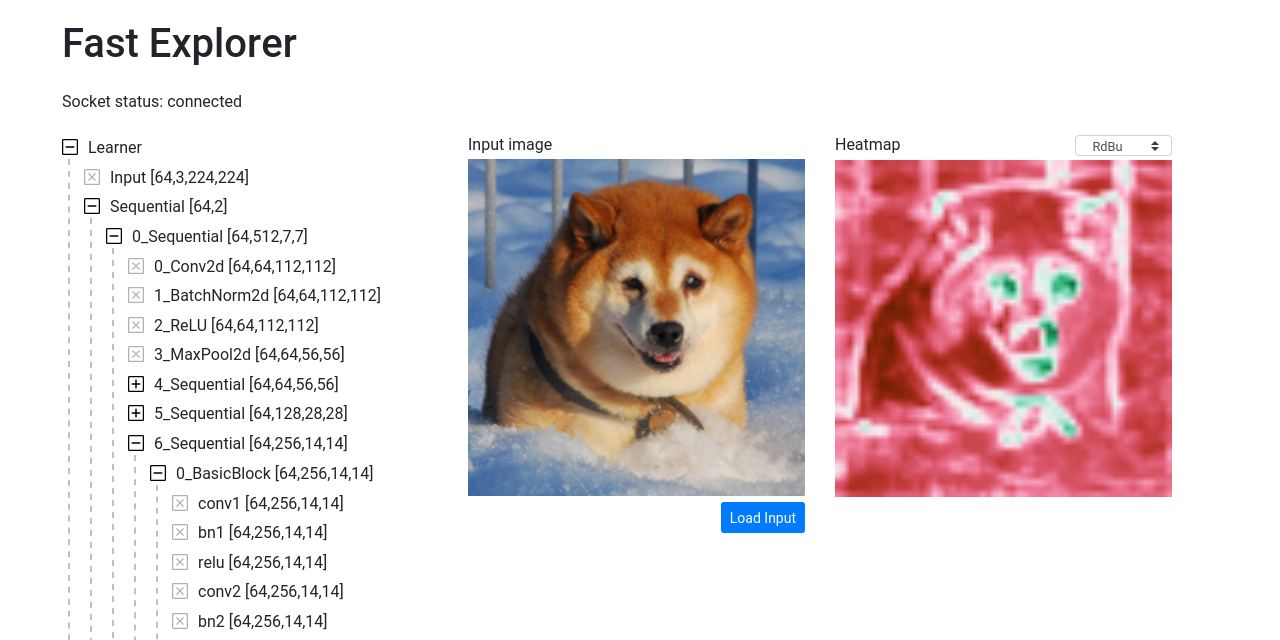
Finally, go to https://renato145.github.io/fastexplorer-js/ to visualize the model:

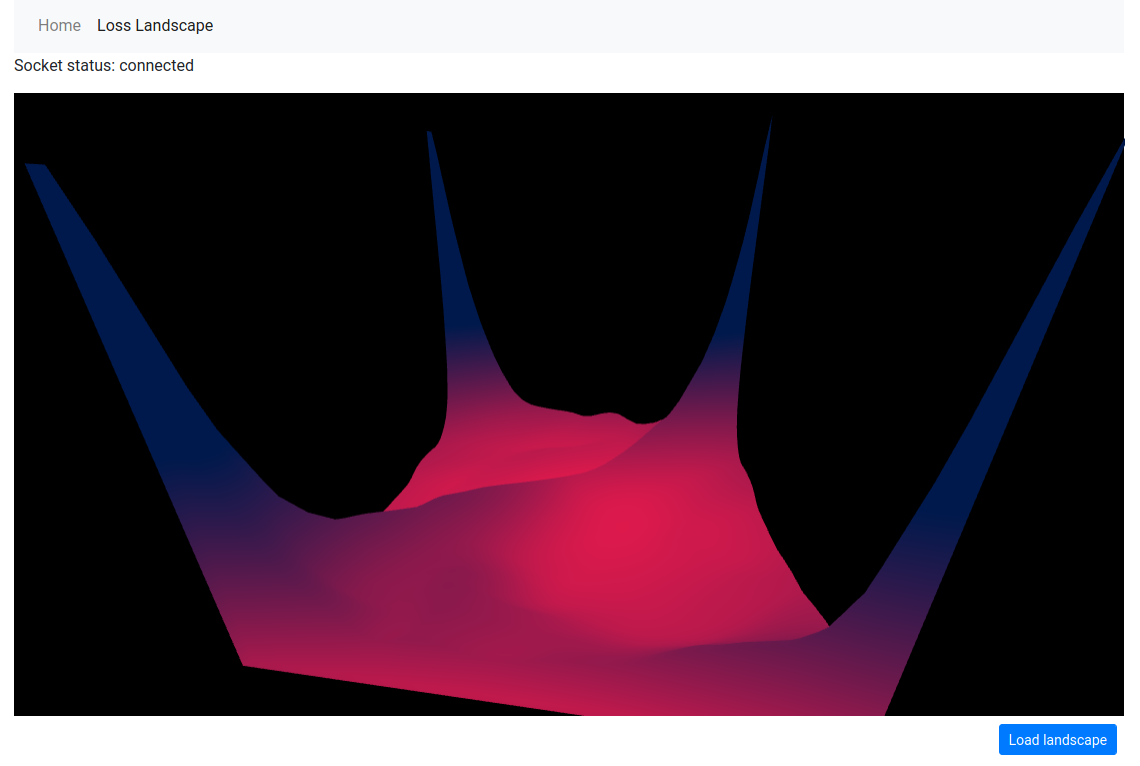
Also, you can visualize the Loss Landscape:
Note that the original work calculates the landscape using the whole dataset which can take a lot of time. In this library, I am using just one batch of data to calculate the landscape (this will probably change once I find a faster way to calculate it).
